 how-to
How to Benchmark Salaries Against the Market
Last Updated: 14 November 2026
Quick Summary
To benchmark salaries, define the role, collect verified data such as payroll actuals and vetted salary guides, match roles on duties rather than titles, normalise pay to annual base salary excluding superannuation, compare P25, median and P75 percentiles, then set pay ranges and record your reasoning. Skipping any step weakens the audit trail.
- A casual hourly rate carries a 25% loading, so blending it into a base-salary pool shifts your median.
- A permanent full-time analyst on AUD 95,000 sits almost exactly at a market median of AUD 96,000.
- Match roles on duties, decision rights and reporting lines, then confirm the level.
- Job-board listings show asking prices, not the clearing rates finance signs off on.
- Keep statutory award minima on a separate floor so they don't drag down commercial quartiles.
Table of Contents
- The Salary Benchmarking Process: A Step-by-Step Guide
- Salary Benchmarking Examples: Matching Roles and Reading Percentiles
- Compensation Benchmarking Tools and How to Create Salary Ranges
- Frequently Asked Questions
The Salary Benchmarking Process: A Step-by-Step Guide
Salary benchmarking compares your internal pay rates against verified external market data for equivalent roles, the most defensible way to answer why a role costs what it costs.
Here's how to benchmark salaries in six steps; skipping any one weakens the audit trail.
- Define the role, job family, level, responsibilities. 2. Collect verified data, payroll actuals, registered EBAs, vetted salary guides, not scraped job ads. 3. Match roles on duties and scope, not titles. 4. Normalise to one baseline, annual base salary, excluding superannuation. 5. Compare percentiles, P25, median, P75. 6. Set pay ranges and record your reasoning, source, date, decision.
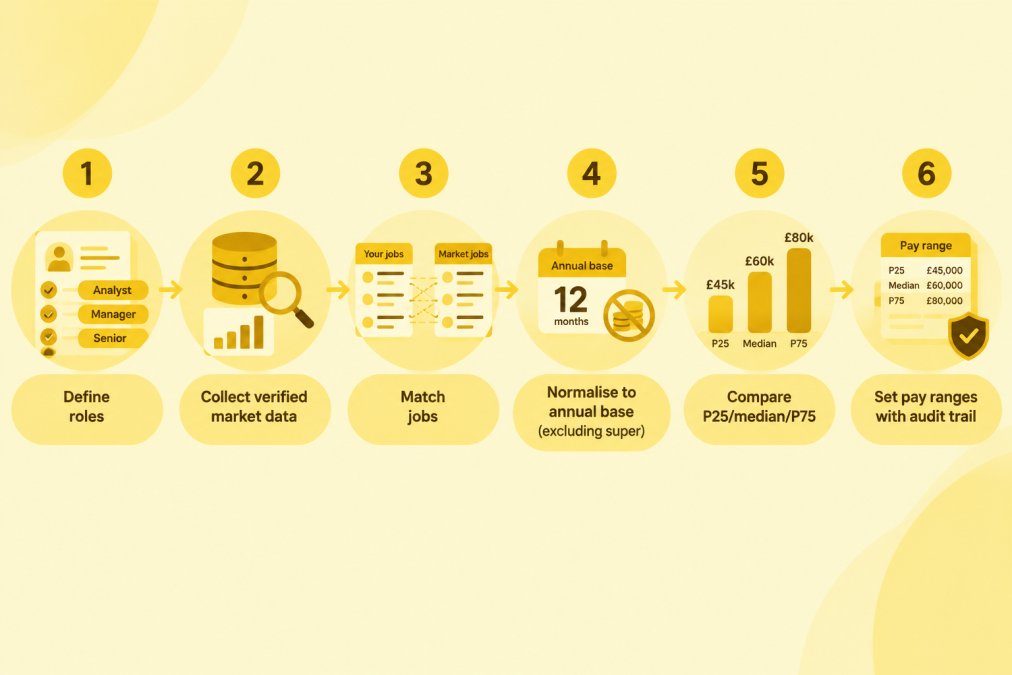
The step most teams rush is normalisation. A casual hourly rate carries a 25% loading; a total package includes the 12% Superannuation Guarantee. Blend either into a base-salary pool and your median drifts.
Documenting each decision matters as much as the numbers; see building a salary audit trail that holds up.
Salary Benchmarking Examples: Matching Roles and Reading Percentiles
Take a permanent full-time analyst on an annual base of AUD 95,000 excluding super, where market data shows P25 of AUD 88,000, a median of AUD 96,000, and P75 of AUD 105,000.
That puts the role almost exactly at median. Nothing to fix, but plenty to document.
Change one variable: the same role in a thin regional market may have only a handful of observations, and a small sample can swing a local median sharply. Treat thin data with caution rather than smoothing it into a national average.
| Percentile | What it tells you | Typical positioning |
|---|---|---|
| P25 | Lower quartile of market pay | Entry-level or developing |
| Median | The midpoint of verified data | Competitive, market-standard |
| P75 | Upper quartile of market pay | Experienced or scarce skills |
Role matching trips up more teams than percentile reading does. A "Senior Analyst" at one employer can carry the scope of a "Lead Analyst" elsewhere. Match on duties, decision rights, and reporting lines, then confirm the level.
Analyst annual base salary against market percentiles
Compensation Benchmarking Tools and How to Create Salary Ranges
Compensation benchmarking tools fall into three broad groups, each suiting a different level of complexity.
| Data source | Best for | Main limitation |
|---|---|---|
| Published salary surveys | Broad market context | Often a year or more old |
| Job-board listings | Quick directional checks | Asking prices, not clearing rates |
| Verified payroll and EBA data | Defensible, role-specific ranges | Needs careful normalisation |
Job-board listings reflect what employers advertise, not the clearing rates finance signs off on.
Once data is clean, anchor the midpoint to your target market position, set the minimum below it, and cap the maximum where the role's value tops out. Keep statutory award minima on a separate floor so they don't drag down commercial quartiles.
At RateIndex, every figure is computed server-side from verified, dated evidence and normalised to annual base salary excluding super before any daily or hourly view. Thin or stale samples get a confidence tier rather than a smoothed-over guess, and workspace isolation keeps your rate cards private.
Benchmarking salaries well comes down to discipline: verified data, honest role matching, and a record of every decision. If your current process lives in a dozen spreadsheets, RateIndex can help. Our platform brings evidence-led market rate intelligence, private rate benchmarking, and proprietary data import into one place, so you can generate a defensible audit trail for every pay decision. Get started with RateIndex and build market rates you can defend in the room.
Frequently Asked Questions
How do you benchmark salaries against the market?
Start by defining each role and its responsibilities, then collect verified market data from salary surveys, registered enterprise agreements and vetted industry reports. Match internal roles to external job families, normalise every figure to annual base excluding super, and compare your pay against P25, median and P75. Record the evidence behind each decision so the benchmark can be defended to finance and auditors. RateIndex computes every figure server-side from dated evidence and flags thin samples with a confidence tier rather than smoothing them over.
How do you create salary ranges using market data?
Build ranges from the percentiles rather than a single midpoint. A common approach sets the minimum near P25, the midpoint at the median and the maximum near P75, then adjusts for location, roster and skills scarcity. Keep statutory award minima on a separate floor so they do not drag down the commercial band. When you benchmark salaries, document the sample size behind each city or roster, because a thin local sample of three or four observations can swing a median by 15-20%.
How can you check whether salary data is reliable?
Ask where the numbers come from: verified payroll actuals and registered agreements, not scraped job-board asking prices. Confirm the dataset separates base salary excluding super from total packages including the 12% Superannuation Guarantee, casual rates with 25% loading and FIFO roster uplifts. Check how many verified observations sit behind your specific location and how the tool behaves when local data is thin. Stale samples older than 365 days should be flagged, not blended into the median.